How to create a custom summary?
Scenario: In QlikView you have a table where some of the totals are the division between two totals, or when there are percentages, so you cannot simply use the group (or report) summary.
Solution 1: Use the custom summary event.
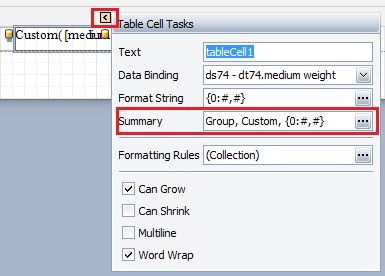
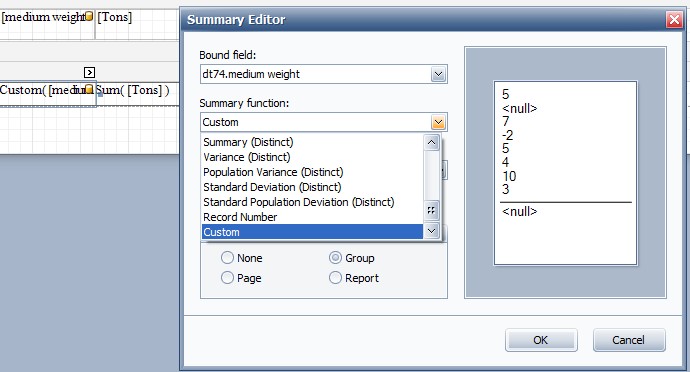
Select the label where you want the Custom summary to be shown. Click on the arrow on the top right corner of the object, click on summary. In the summary editor chose Custom from the Summary function drop down menu.
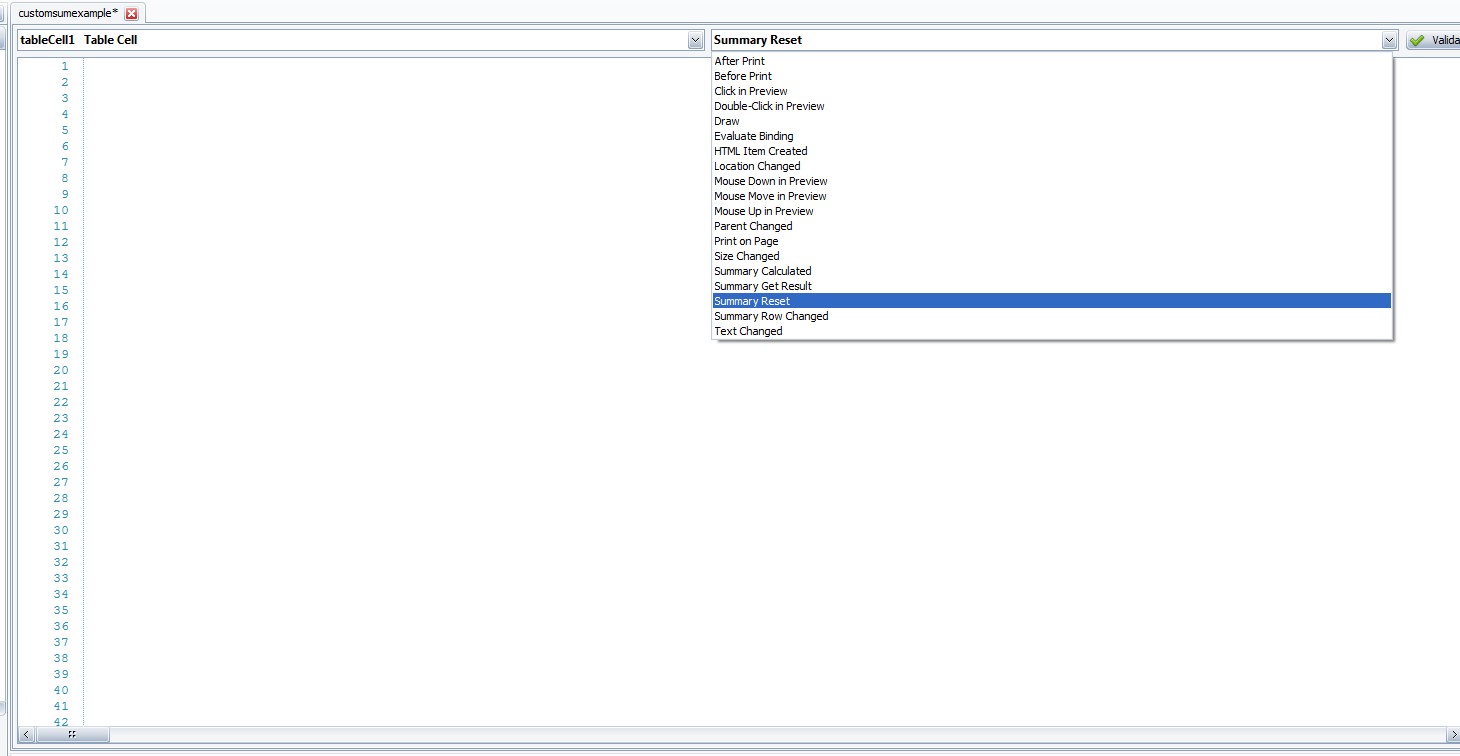
Then while the cell (or label) is still selected, go to Scripts and follow the following steps.
- Declare the variables. In our examples they are two:
double v1=0;
double v2=0;
- Use the Summary Reset function to set the variables to 0:
private void tableCell1_SummaryReset(object sender, System.EventArgs e) {
v1=0;
v2=0;
}
- Use the Summary Row Changed function to perform the partial sums.
private void tableCell1_SummaryRowChanged(object sender, System.EventArgs e) {
v1 += Convert.ToDouble(GetCurrentColumnValue("Tons"));
v2 += Convert.ToDouble(GetCurrentColumnValue("V.A."));
}
- Use the Summary Get Result function to obtain and display the result.
private void tableCell1_SummaryGetResult(object sender, DevExpress.XtraReports.UI.SummaryGetResultEventArgs e) {
e.Result = (v2/v1);
e.Handled = true;
Solution 2: Use a pivot grid with unbound fields.
First of all, all the field for you calculation must be in the report’s dataset.
Drag and drop the pivot grid control inside your report (report header or footer is the correct space to place it). Then, having the pivot grid still selected, go to its properties, and in data options, change the Data Field Unbound Expression mode to “use summary values”.

Now, in the designer, in the fields’ window, retrieve all the fields you need in the table, and the one you need for the calculation. Then add a new field with the “add column” button. A PivotGridField1 will be added to the XRPivotGrid field list.
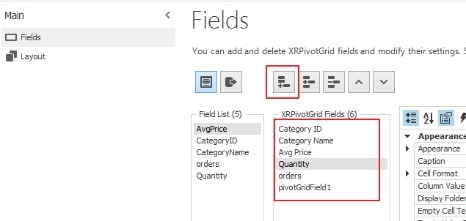
Then select the fields you will use for your calculation. For all of them in the behaviour menu, select the Data Area in the Area dropdown menu (it is possible to set the visible property to No if they have not to be in the table)
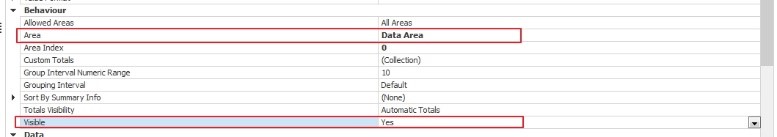
Then select the New field you added in the list, add it to the Data Area and go to the Data submenu.
Click on the ellipsis in Unbound expression and create the formula with the fields and the expression in the editor and save it. In unbound type select the type, and choose a name for the field in the Column Data Name, and the Field Name. Choose also a Caption Name (the one that will appear in the Table label) in the Appearance submenu. In Layout, order the column as you prefer and the table will be ready.
Related Articles
How to create a multi-column report?
Scenario: the desired output is like this: a multicolumn output from a straight table in QlikView™ Solution: create a multicolumn layout for the detail band. Click on the little arrow on the detail band header, while the band is selected. In the ...How to create a chart with auto created series?
Scenario: you have this bar chart in QlikView. The straight table for it is this one, with one column for type, one for date, and one for number. You cannot use series to create that chart in BIReport, since you do not have a column for each type. ...