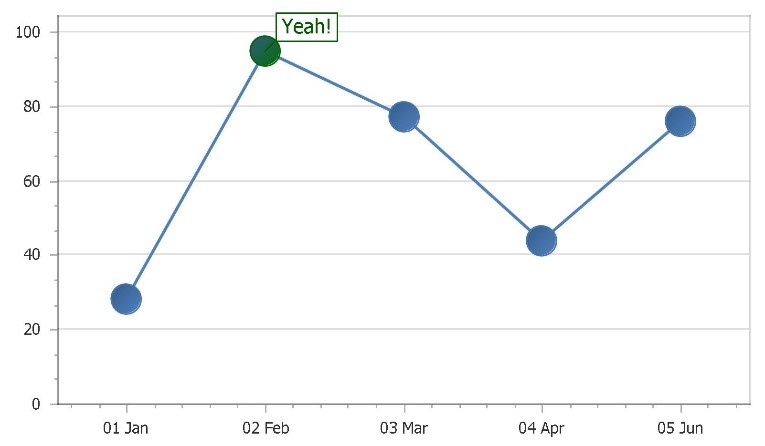
How to add an alert label to the chart?
Scenario: In a chart, you want to show a label with an alert every time a value surpasses a defined threshold.
Solution: Replicate the procedure in the previous section, using the function:
private void ChangeLabelText(object sender, DevExpress.XtraCharts.CustomDrawSeriesPointEventArgs e) {
var value = Convert.ToDouble(e.SeriesPoint.Values[0]);
e.LabelText = "";
if(value>80)
{
e.SeriesDrawOptions.Color = Color.FromArgb(4, 110, 4);
e.LabelText = "Yeah!";
}
}
The output will be:
Related Articles
How to add an index?
From the toolbox, drag and drop the tool Table of Contents in the Report Header. Open the Table of contents tasks window clicking on the little arrow on the top right of the object, click on the ellipsis and Add a new level. Set the appearance and ...How to conditionally colour a chart?
Scenario: In a bar chart, you want each bar colour depending on its value. Solution: Add the chart to the Report, and with the chart selected go to scripts. Add the following script: // Apply different colors to the bars depending on their value ...How to create a chart with auto created series?
Scenario: you have this bar chart in QlikView. The straight table for it is this one, with one column for type, one for date, and one for number. You cannot use series to create that chart in BIReport, since you do not have a column for each type. ...